STOmics’ flagship technology, Spatial Enhanced REsolution Omics-sequencing (Stereo-seq), is an advanced spatial transcriptomics platform based on DNA Nano Ball (DNB) technology. This cutting-edge system offers unparalleled resolution, throughput, and field of view, enabling comprehensive spatial transcriptomic analysis across multiple scales—tissue, cellular, subcellular, and molecular levels. Using a patterned array chip and Coordinate ID (CID) system, Stereo-seq captures mRNA directly from tissue samples, restoring its precise spatial coordinates. As a transformative tool, Stereo-seq empowers researchers to elucidate the complex relationships between gene expression, cell morphology, and their local microenvironments.

STOmics Spatial Gene Expression
Comprehensive spatial gene expression analysis to map transcriptomic landscapes across tissue sections and support the discovery of spatially defined cellular organization and function.

Benefits of Novogene’s STOmics Spatial Transcriptomics Service


Large Area High Resolution
500 nm resolution with up to 13 cm × 13 cm capture area for gene and imaging analysis
Large Area High Resolution
500 nm resolution with up to 13 cm × 13 cm capture area for gene and imaging analysis


Broad Sample Compatibility
Compatible with fresh-frozen and FFPE samples across diverse animal and plant tissue types
Broad Sample Compatibility
Compatible with fresh-frozen and FFPE samples across diverse animal and plant tissue types


Pathology Integration
Single-section staining enables simultaneous pathological assessment and spatial transcriptomics analysis
Pathology Integration
Single-section staining enables simultaneous pathological assessment and spatial transcriptomics analysis
Benefits of Novogene’s STOmics Spatial Transcriptomics Service
Large Area High Resolution
500 nm resolution with up to 13 cm × 13 cm capture area for gene and imaging analysis
Large Area High Resolution
500 nm resolution with up to 13 cm × 13 cm capture area for gene and imaging analysis
Broad Sample Compatibility
Compatible with fresh-frozen and FFPE samples across diverse animal and plant tissue types
Broad Sample Compatibility
Compatible with fresh-frozen and FFPE samples across diverse animal and plant tissue types
Pathology Integration
Single-section staining enables simultaneous pathological assessment and spatial transcriptomics analysis
Pathology Integration
Single-section staining enables simultaneous pathological assessment and spatial transcriptomics analysis
Applications
Tumor Microenvironment Research
Characterize the molecular and cellular landscape of the tumor microenvironment.
Tumor Microenvironment Research
Characterize the molecular and cellular landscape of the tumor microenvironment.
Immunology
Map the spatial distribution and interactions of immune cells within tissues.
Immunology
Map the spatial distribution and interactions of immune cells within tissues.
Neuroscience
Investigate neural cell function and expression patterns at unprecedented resolution.
Neuroscience
Investigate neural cell function and expression patterns at unprecedented resolution.
Biomarker Discovery
Identify cell-specific biomarkers for disease diagnosis and therapy development.
Biomarker Discovery
Identify cell-specific biomarkers for disease diagnosis and therapy development.
Specifications
Sample Requirements
Sample amounts are listed for reference only. Download the Sample Submission Guidelines to learn more. For detailed information, please contact us with your customized requests.
*FFPE glass slides must be positive charged glass slides.
| Service | Sample Type | Sample Amount | Preservation | Sample QC | Shipping |
|---|---|---|---|---|---|
| Stereo-seq OMNI (Animal with reference genome) | FFPE block (recommended) | 1 block, FFPE block must be contained on plastic dehydrating box, otherwise could not be installed on the sectioning device | Preservation After embedding store at 4°C, protected from light | DV200% ≥ 30% | Cold pack transportation |
| FFPE section | RNA quality control sample: 10-15 sections of 5 μm thick paraffin rolls (at least 10 sections for biopsy samples); Formal sample: 4-6 sections of 5 μm thick paraffin sections (adjacent sections). | Dry and sealed,storage time at 4°C< 30 days |
Sequencing and Analysis
Recommended data outputs and analysis contents displayed are for reference only. For detailed information, please contact us with your customized requests.
| Stereo-seq (FFPE) | |
|---|---|
| Species | No species limitation |
| Resolution | 500nm |
| Sequencing platform | BGI DNB-SEQ T7 |
| Read length | PE75 |
| Recommended Data Amount | 2.5B reads per sample |
| Analysis | Data QC Mapping and Quantification Dimensionality Reduction, Clustering, and Differential analysis: Graphclust clustering K-means clustering Seurat Analysis: PCA analysis Spatial variable gene expression analysis Clustering and dimensionality reduction analysis Differential Expression Gene Analysis (DEG) DEGs clustering heatmap Spatial distribution of DEGs Violine plot t-SNE and UMAP dimensional reduction visualization Functional Enrichment Analysis: GO enrichment KEGG enrichment Reactome enrichment |
Project Workflow
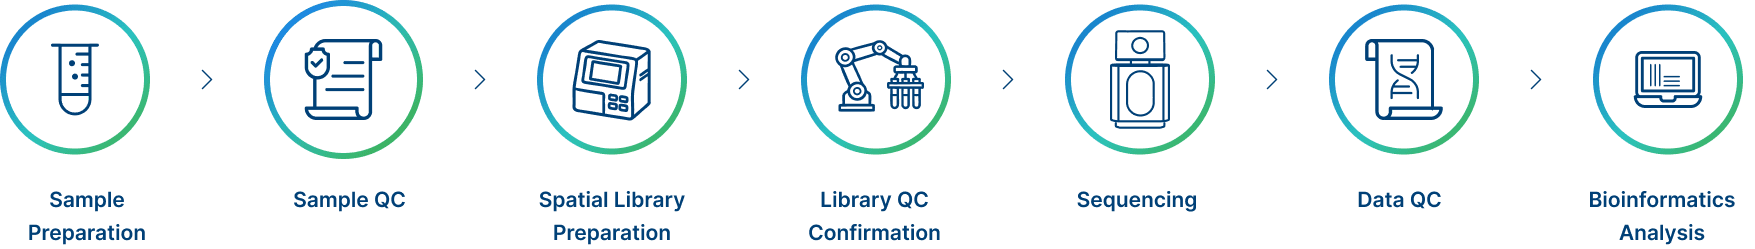
Project Workflow
Project Workflow
Project Workflow
Specifications
Sample Requirements
Sample amounts are listed for reference only. Download the Sample Submission Guidelines to learn more. For detailed information, please contact us with your customized requests.
*FFPE glass slides must be positive charged glass slides.
| Service | Sample Type | Sample Amount | Preservation | Sample QC | Shipping |
|---|---|---|---|---|---|
| Stereo-seq OMNI (Animal with reference genome) | FFPE block (recommended) | 1 block, FFPE block must be contained on plastic dehydrating box, otherwise could not be installed on the sectioning device | Preservation After embedding store at 4°C, protected from light | DV200% ≥ 30% | Cold pack transportation |
| FFPE section | RNA quality control sample: 10-15 sections of 5 μm thick paraffin rolls (at least 10 sections for biopsy samples); Formal sample: 4-6 sections of 5 μm thick paraffin sections (adjacent sections). | Dry and sealed,storage time at 4°C< 30 days |
Sample Requirements
Sample amounts are listed for reference only. Download the Sample Submission Guidelines to learn more. For detailed information, please contact us with your customized requests.
*FFPE glass slides must be positive charged glass slides.
| Service | Sample Type | Sample Amount | Preservation | Sample QC | Shipping |
|---|---|---|---|---|---|
| Stereo-seq OMNI (Animal with reference genome) | FFPE block (recommended) | 1 block, FFPE block must be contained on plastic dehydrating box, otherwise could not be installed on the sectioning device | Preservation After embedding store at 4°C, protected from light | DV200% ≥ 30% | Cold pack transportation |
| FFPE section | RNA quality control sample: 10-15 sections of 5 μm thick paraffin rolls (at least 10 sections for biopsy samples); Formal sample: 4-6 sections of 5 μm thick paraffin sections (adjacent sections). | Dry and sealed,storage time at 4°C< 30 days |
Sample Requirements
Sample amounts are listed for reference only. Download the Sample Submission Guidelines to learn more. For detailed information, please contact us with your customized requests.
*FFPE glass slides must be positive charged glass slides.
| Service | Sample Type | Sample Amount | Preservation | Sample QC | Shipping |
|---|---|---|---|---|---|
| Stereo-seq OMNI (Animal with reference genome) | FFPE block (recommended) | 1 block, FFPE block must be contained on plastic dehydrating box, otherwise could not be installed on the sectioning device | Preservation After embedding store at 4°C, protected from light | DV200% ≥ 30% | Cold pack transportation |
| FFPE section | RNA quality control sample: 10-15 sections of 5 μm thick paraffin rolls (at least 10 sections for biopsy samples); Formal sample: 4-6 sections of 5 μm thick paraffin sections (adjacent sections). | Dry and sealed,storage time at 4°C< 30 days |
Sample Requirements
Sample amounts are listed for reference only. Download the Sample Submission Guidelines to learn more. For detailed information, please contact us with your customized requests.
*FFPE glass slides must be positive charged glass slides.
| Service | Sample Type | Sample Amount | Preservation | Sample QC | Shipping |
|---|---|---|---|---|---|
| Stereo-seq OMNI (Animal with reference genome) | FFPE block (recommended) | 1 block, FFPE block must be contained on plastic dehydrating box, otherwise could not be installed on the sectioning device | Preservation After embedding store at 4°C, protected from light | DV200% ≥ 30% | Cold pack transportation |
| FFPE section | RNA quality control sample: 10-15 sections of 5 μm thick paraffin rolls (at least 10 sections for biopsy samples); Formal sample: 4-6 sections of 5 μm thick paraffin sections (adjacent sections). | Dry and sealed,storage time at 4°C< 30 days |
Sequencing and Analysis
Recommended data outputs and analysis contents displayed are for reference only. For detailed information, please contact us with your customized requests.
| Stereo-seq (FFPE) | |
|---|---|
| Species | No species limitation |
| Resolution | 500nm |
| Sequencing platform | BGI DNB-SEQ T7 |
| Read length | PE75 |
| Recommended Data Amount | 2.5B reads per sample |
| Analysis | Data QC Mapping and Quantification Dimensionality Reduction, Clustering, and Differential analysis: Graphclust clustering K-means clustering Seurat Analysis: PCA analysis Spatial variable gene expression analysis Clustering and dimensionality reduction analysis Differential Expression Gene Analysis (DEG) DEGs clustering heatmap Spatial distribution of DEGs Violine plot t-SNE and UMAP dimensional reduction visualization Functional Enrichment Analysis: GO enrichment KEGG enrichment Reactome enrichment |
Sequencing and Analysis
Recommended data outputs and analysis contents displayed are for reference only. For detailed information, please contact us with your customized requests.
| Stereo-seq (FFPE) | |
|---|---|
| Species | No species limitation |
| Resolution | 500nm |
| Sequencing platform | BGI DNB-SEQ T7 |
| Read length | PE75 |
| Recommended Data Amount | 2.5B reads per sample |
| Analysis | Data QC Mapping and Quantification Dimensionality Reduction, Clustering, and Differential analysis: Graphclust clustering K-means clustering Seurat Analysis: PCA analysis Spatial variable gene expression analysis Clustering and dimensionality reduction analysis Differential Expression Gene Analysis (DEG) DEGs clustering heatmap Spatial distribution of DEGs Violine plot t-SNE and UMAP dimensional reduction visualization Functional Enrichment Analysis: GO enrichment KEGG enrichment Reactome enrichment |
Sequencing and Analysis
Recommended data outputs and analysis contents displayed are for reference only. For detailed information, please contact us with your customized requests.
| Stereo-seq (FFPE) | |
|---|---|
| Species | No species limitation |
| Resolution | 500nm |
| Sequencing platform | BGI DNB-SEQ T7 |
| Read length | PE75 |
| Recommended Data Amount | 2.5B reads per sample |
| Analysis | Data QC Mapping and Quantification Dimensionality Reduction, Clustering, and Differential analysis: Graphclust clustering K-means clustering Seurat Analysis: PCA analysis Spatial variable gene expression analysis Clustering and dimensionality reduction analysis Differential Expression Gene Analysis (DEG) DEGs clustering heatmap Spatial distribution of DEGs Violine plot t-SNE and UMAP dimensional reduction visualization Functional Enrichment Analysis: GO enrichment KEGG enrichment Reactome enrichment |
Sequencing and Analysis
Recommended data outputs and analysis contents displayed are for reference only. For detailed information, please contact us with your customized requests.
| Stereo-seq (FFPE) | |
|---|---|
| Species | No species limitation |
| Resolution | 500nm |
| Sequencing platform | BGI DNB-SEQ T7 |
| Read length | PE75 |
| Recommended Data Amount | 2.5B reads per sample |
| Analysis | Data QC Mapping and Quantification Dimensionality Reduction, Clustering, and Differential analysis: Graphclust clustering K-means clustering Seurat Analysis: PCA analysis Spatial variable gene expression analysis Clustering and dimensionality reduction analysis Differential Expression Gene Analysis (DEG) DEGs clustering heatmap Spatial distribution of DEGs Violine plot t-SNE and UMAP dimensional reduction visualization Functional Enrichment Analysis: GO enrichment KEGG enrichment Reactome enrichment |
Project Workflow
Project Workflow
Project Workflow
Project Workflow
Resources
Demo Results
1/1
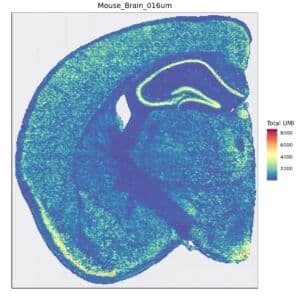
Space Ranger is used to count the UMI for each gene on every bin, obtaining a bin-gene expression matrix for the sample. After performing data QC, the figure below shows the distribution of UMI per gene across the spatial regions of the tissue.
1/1
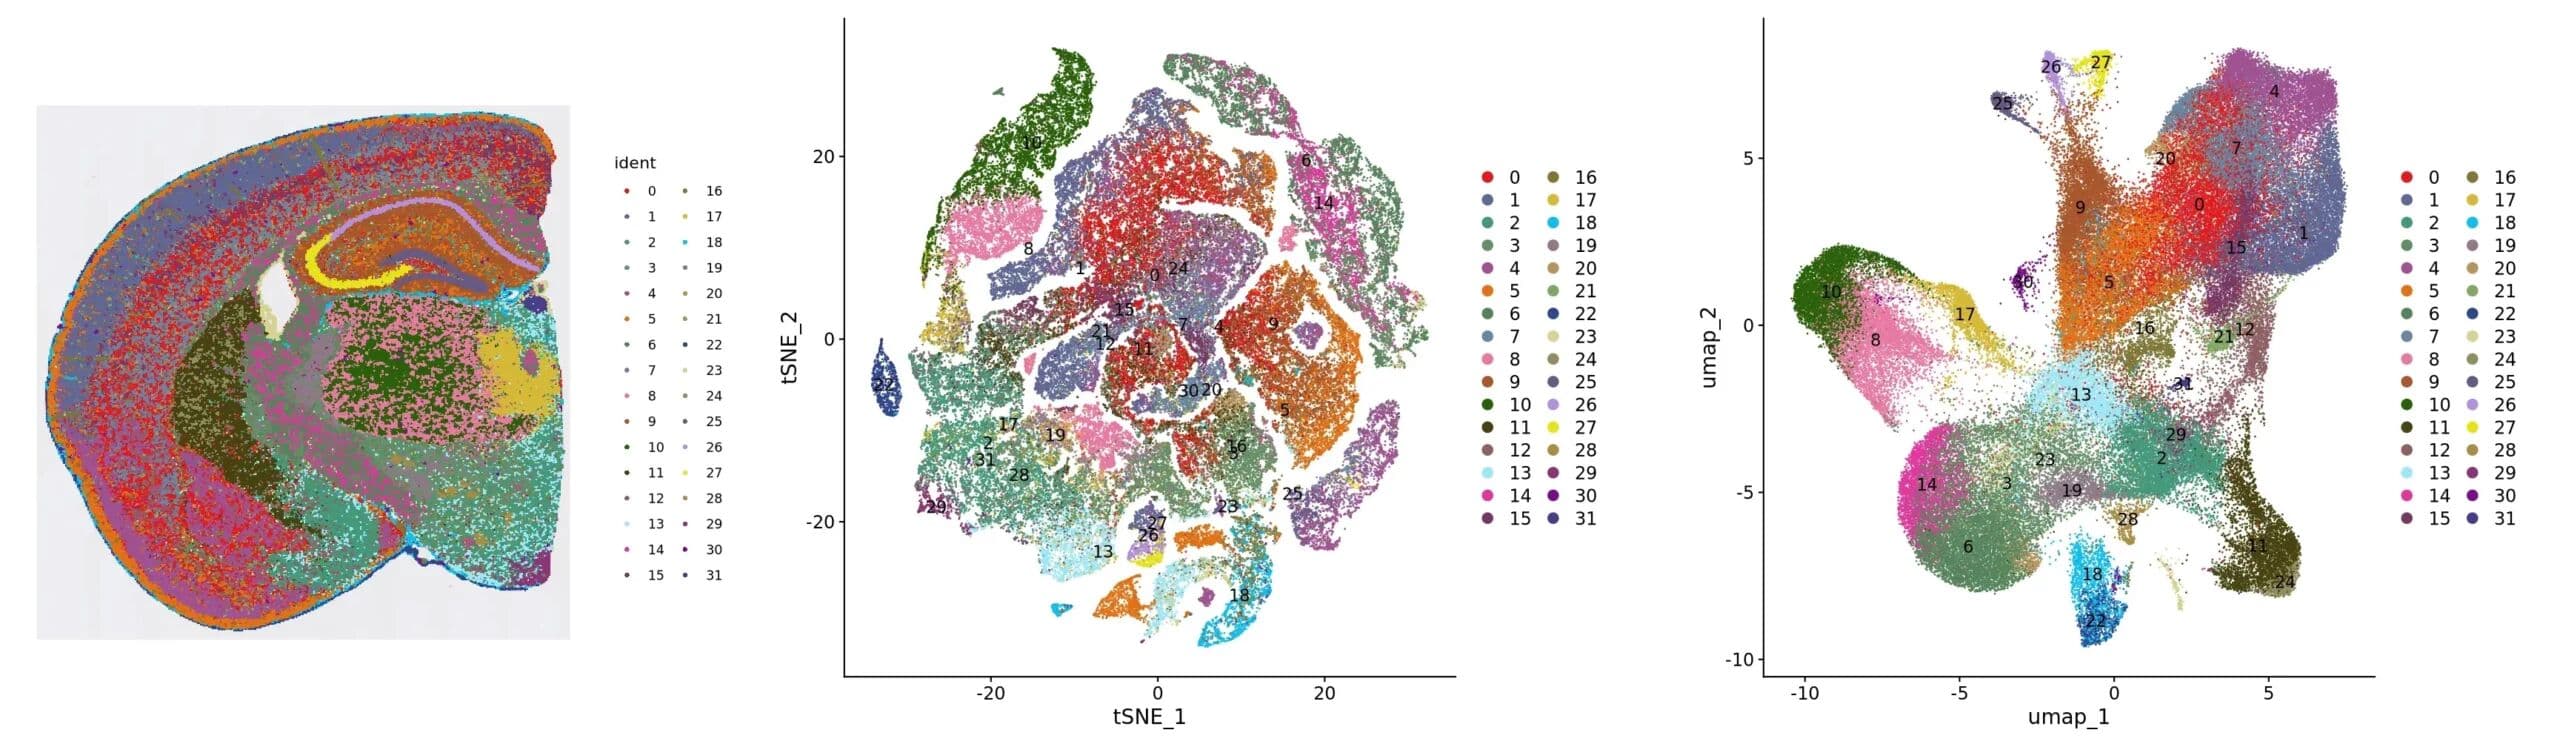
Cluster_Spatial: spatial distribution map of clusters; Cluster_tSNE: tSNE two-dimensional spatial representation map of clusters; Cluster_UMAP: UMAP two-dimensional spatial representation map of clusters
1/1
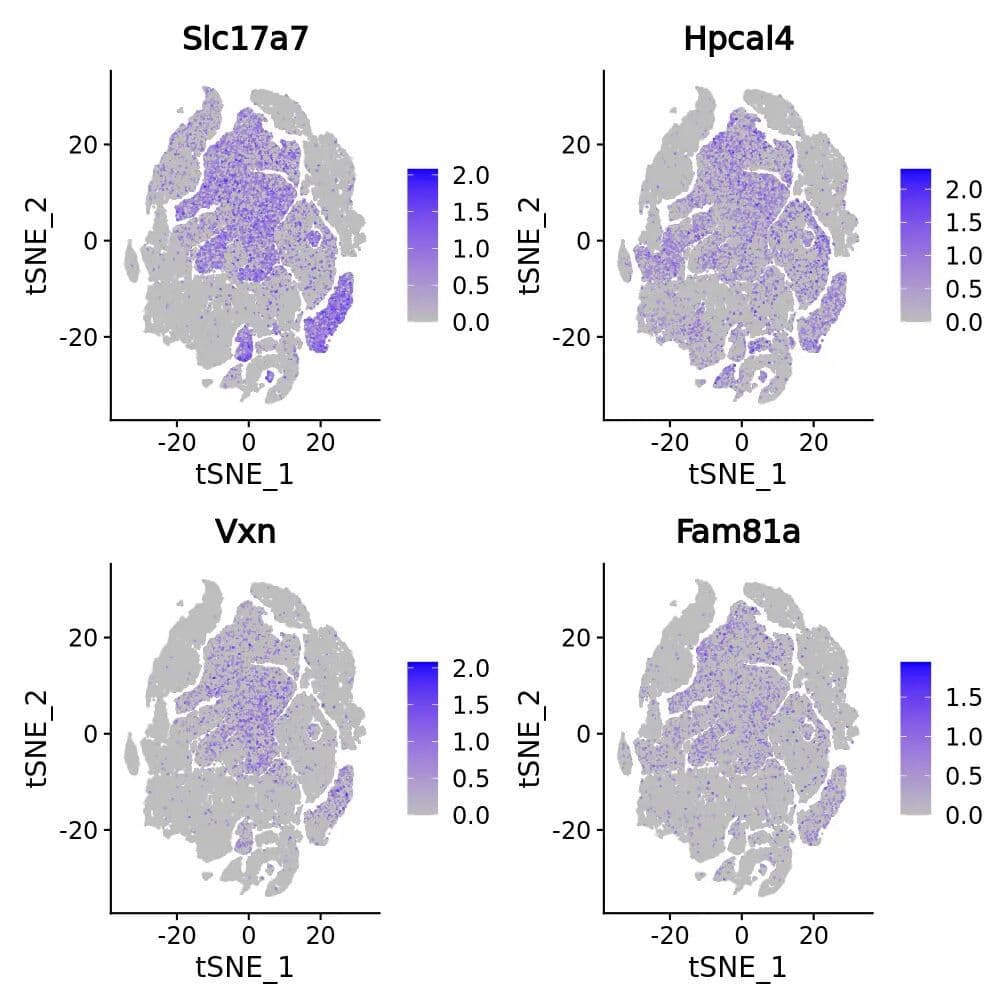
The top 4 differentially expressed genes of each cluster are displayed in several ways. The figure presents the t-SNE and UMAP dimensional reduction visualization of differentially expressed genes.
1/1
Space Ranger is used to count the UMI for each gene on every bin, obtaining a bin-gene expression matrix for the sample. After performing data QC, the figure below shows the distribution of UMI per gene across the spatial regions of the tissue.
1/1
Cluster_Spatial: spatial distribution map of clusters; Cluster_tSNE: tSNE two-dimensional spatial representation map of clusters; Cluster_UMAP: UMAP two-dimensional spatial representation map of clusters
1/1
The top 4 differentially expressed genes of each cluster are displayed in several ways. The figure presents the t-SNE and UMAP dimensional reduction visualization of differentially expressed genes.
Service flyers

Novogene Stereo-seq OMNI Spatial Transcriptome Sequencing
Stereo-seq is an advanced technology that combines transcriptomics with spatial information. It enables mapping gene expression in tissue samples while preserving their spatial organization. Stereo-seq OMNI, a revolutionary sequencing-based spatial transcriptomics solution specially designed for studying FFPE samples, provides high-definition spatial whole transcriptome information at single-cell scale.
Ready to Start Your Project?
Our platform offers tailored solutions for
your unique experimental needs, ensuring a seamless experience from project design to data delivery.